
Ripple Price Prediction: XRP Struggles Below $1 as Bears Eye Another Drop to $0.89
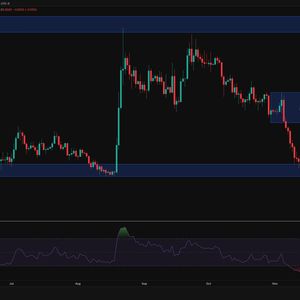
Ripple is consolidating near $0. 95 after breaking below the psychological $1 level and its August support base. Although momentum has recovered from extreme lows, buyers have yet to reclaim the broken zone, keeping the broader outlook bearish.
Ripple Price Analysis: The Daily Chart The daily chart shows a sustained decline following XRP’s rejection from the $1. 20–$1. 34 main supply zone.
Selling accelerated through the $0. 985–$1. 035 demand area, erasing the base that preceded August’s sharp rally and carrying the price toward $0.
89. The subsequent rebound has lifted Ripple back toward $0. 95, but it remains beneath former support.
The $0. 985–$1. 035 zone now represents an important recovery hurdle, with the psychological $1 level reinforcing its significance.
A rejection from this area would preserve the bearish structure and leave the recent low exposed. The daily RSI sits near 26, indicating oversold conditions despite recovering from its latest trough. This creates room for a corrective bounce, but does not confirm a trend reversal.
Buyers need a sustained reclaim of the broken support zone to demonstrate that demand is returning. If XRP fails to recover that area, another test of $0. 89–$0.
91 remains plausible. A decisive break beneath the recent low would extend the sequence of lower lows, with no clearly marked demand zone below it on the supplied chart. Source: TradingView XRP/USDT 4-Hour Chart On the four-hour timeframe, XRP has formed a narrow consolidation around $0.
94–$0. 97 after rebounding sharply from approximately $0. 89.
Smaller candles suggest that the initial selling impulse has slowed, although the recovery has yet to produce a meaningful bullish structure shift. The four-hour RSI has recovered toward 41, showing improving momentum while remaining below the neutral midpoint. This supports stabilization, but buyers still need to overcome the local highs around $0.
97–$0. 98 before challenging the $0. 985–$1.
035 resistance zone. A sustained move above that zone would weaken the immediate bearish continuation setup and could allow a recovery toward the previous consolidation around $1. 06–$1.
10. The broader $1. 20–$1.
34 supply zone remains the main structural barrier farther overhead. Source: TradingView Conversely, a breakdown beneath the current consolidation around $0. 94 would increase the risk of a return toward $0.
91 and the $0. 89 low. Until Ripple reclaims former support, the sideways action is best viewed as a pause within the downtrend.
Coins mentioned in this story

Get NEXAPI Access
Pull the market data behind stories like this — top-100 prices, daily history and news — through our REST API.
More from Newport Intelligence
Ethereum Price Prediction: Can ETH Reclaim $2,000 as BitMine Stakes 5.23 Million Tokens?
November 17, 2026
Pump.fun adds Polymarket prediction markets to mobile app
November 17, 2026
Hackers Inject Crypto-Stealing Malware Into 178 Websites
November 17, 2026
Is $1,100 Possible for Solana? Bitwise Reveals Its 2031 Price Predictions (Bond and Fall) for SOL!
November 17, 2026