
Ethereum Price Analysis: What’s the Worst-Case Scenario if ETH Loses $2.5K Support?
Ethereum is stabilizing around $2. 5K after another sharp test of demand near $2. 4K.
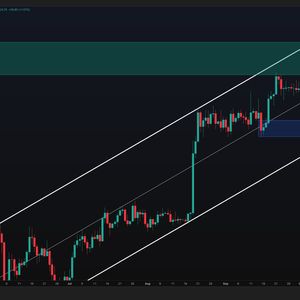
Buyers have defended the recent lows, but the recovery remains below key resistance, leaving the market caught between a potential base and another leg lower. Ethereum Price Analysis: The Daily Chart On the daily timeframe, Ethereum remains within its broader ascending channel despite the recent correction. The decline from approximately $2.
8K pushed the price below the channel’s midpoint and into the highlighted $2. 36K–$2. 46K demand zone.
Two pronounced lower wicks into this region suggest buyers are responding to selling pressure, though subsequent rebounds have remained relatively modest. The latest recovery toward $2. 52K keeps ETH above demand, but a move through the recent rebound highs around $2.
56K–$2. 58K is needed to demonstrate improving momentum. Beyond that, the former consolidation around $2.
67K–$2. 75K represents an important resistance area. Reclaiming it could support another challenge of the broader $2.
79K–$3. 05K supply zone. Conversely, renewed weakness would bring the $2.
36K–$2. 46K demand zone back into focus. This area overlaps with the channel’s rising lower boundary, making it a significant support confluence.
A sustained breakdown beneath both would weaken the broader recovery structure and increase the risk of a deeper correction toward $2. 3K and $2. 2K.
ETH/USDT 4-Hour Chart The 4-hour chart highlights two sharp declines toward the rising lower trendline around $2. 4K–$2. 42K, each followed by a rebound.
These reactions suggest that buyers are defending the lower portion of the structure, but the latest recovery has yet to clear the previous rebound high near $2. 58K. In the immediate term, ETH is consolidating around $2.
5K–$2. 53K. A sustained break above this narrow range could bring the $2.
56K–$2. 58K resistance area into play. Clearing that barrier would strengthen the base-building scenario and open the way toward the marked $2.
68K–$2. 74K supply zone, where the earlier consolidation broke down. On the downside, losing $2.
48K would expose the upper boundary of demand near $2. 46K and potentially trigger another test of the rising trendline around $2. 41K.
Repeated tests make the response at this support increasingly important. A decisive loss of the trendline and the $2. 36K demand boundary would undermine the current stabilization attempt.
Sentiment Analysis The two-week Binance ETH/USDT liquidation heatmap shows substantial estimated liquidation concentrations above the current price. The nearest prominent overhead band sits around $2. 58K–$2.
6K, followed by another strong cluster near $2. 63K–$2. 65K.
Additional concentrations remain higher around $2. 74K–$2. 8K.
The nearby $2. 58K–$2. 6K cluster aligns with the recent rebound high, making this region relevant to both price structure and leveraged positioning.
A sustained advance through it could trigger short liquidations and accelerate the recovery toward the next overhead pool. However, reaching these levels would not itself confirm a lasting bullish reversal. Below price, estimated liquidation bands remain around $2.
47K–$2. 49K and the broader $2. 37K–$2.
4K region. Another loss of nearby support could expose these concentrations and amplify selling through long liquidations. The heatmap therefore highlights potential volatility on both sides, with a break above $2.
58K or renewed weakness beneath $2. 48K likely to clarify the immediate direction.
Coins mentioned in this story

Get NEXAPI Access
Pull the market data behind stories like this — top-100 prices, daily history and news — through our REST API.
More from Newport Intelligence
Bitcoin Price Plunges as September CPI Comes Out Higher Than Expected
October 14, 2026
BREAKING! Critical US Inflation Data Released! Here’s Bitcoin’s (BTC) Initial Reaction!
October 14, 2026
Coinbase Calls for Early Bitcoin Migration to Quantum Security
October 14, 2026
Jensen Huang Says NVIDIA Uses AI to Design Better Chips as Research Spending Jumps 64% to $7 Billion
October 14, 2026